Early Career & Career Change MBA
Ideal for recent undergrads or career changers, this Salem-based MBA program is rich with elective options and hands-on opportunities.

With programs in Portland and Salem, we are home of the #1 MBA in Oregon and the #2 MBA in the Pacific Northwest.

AGSM offers three distinct MBA degrees, plus a variety of executive education and certificate programs. Wherever you are on your professional journey, we likely have an option for you.
Ideal for recent undergrads or career changers, this Salem-based MBA program is rich with elective options and hands-on opportunities.

This intensive, accelerated MBA program is designed for ambitious students looking to get a jumpstart in their careers.

Combine the power of STEM and management. Our program helps students use analytical tools to drive important management decisions.

Available in Salem and Portland, this evening, part-time MBA program allows you to advance your career without putting it on hold.

Browse our industry-specific training programs for executives in areas like leadership, utility or public management.

Our one-year MS in Accounting and Finance is an economy-resilient degree that blends liberal arts skills with technical depth.

Bloomberg Businessweek 2025-26
Other
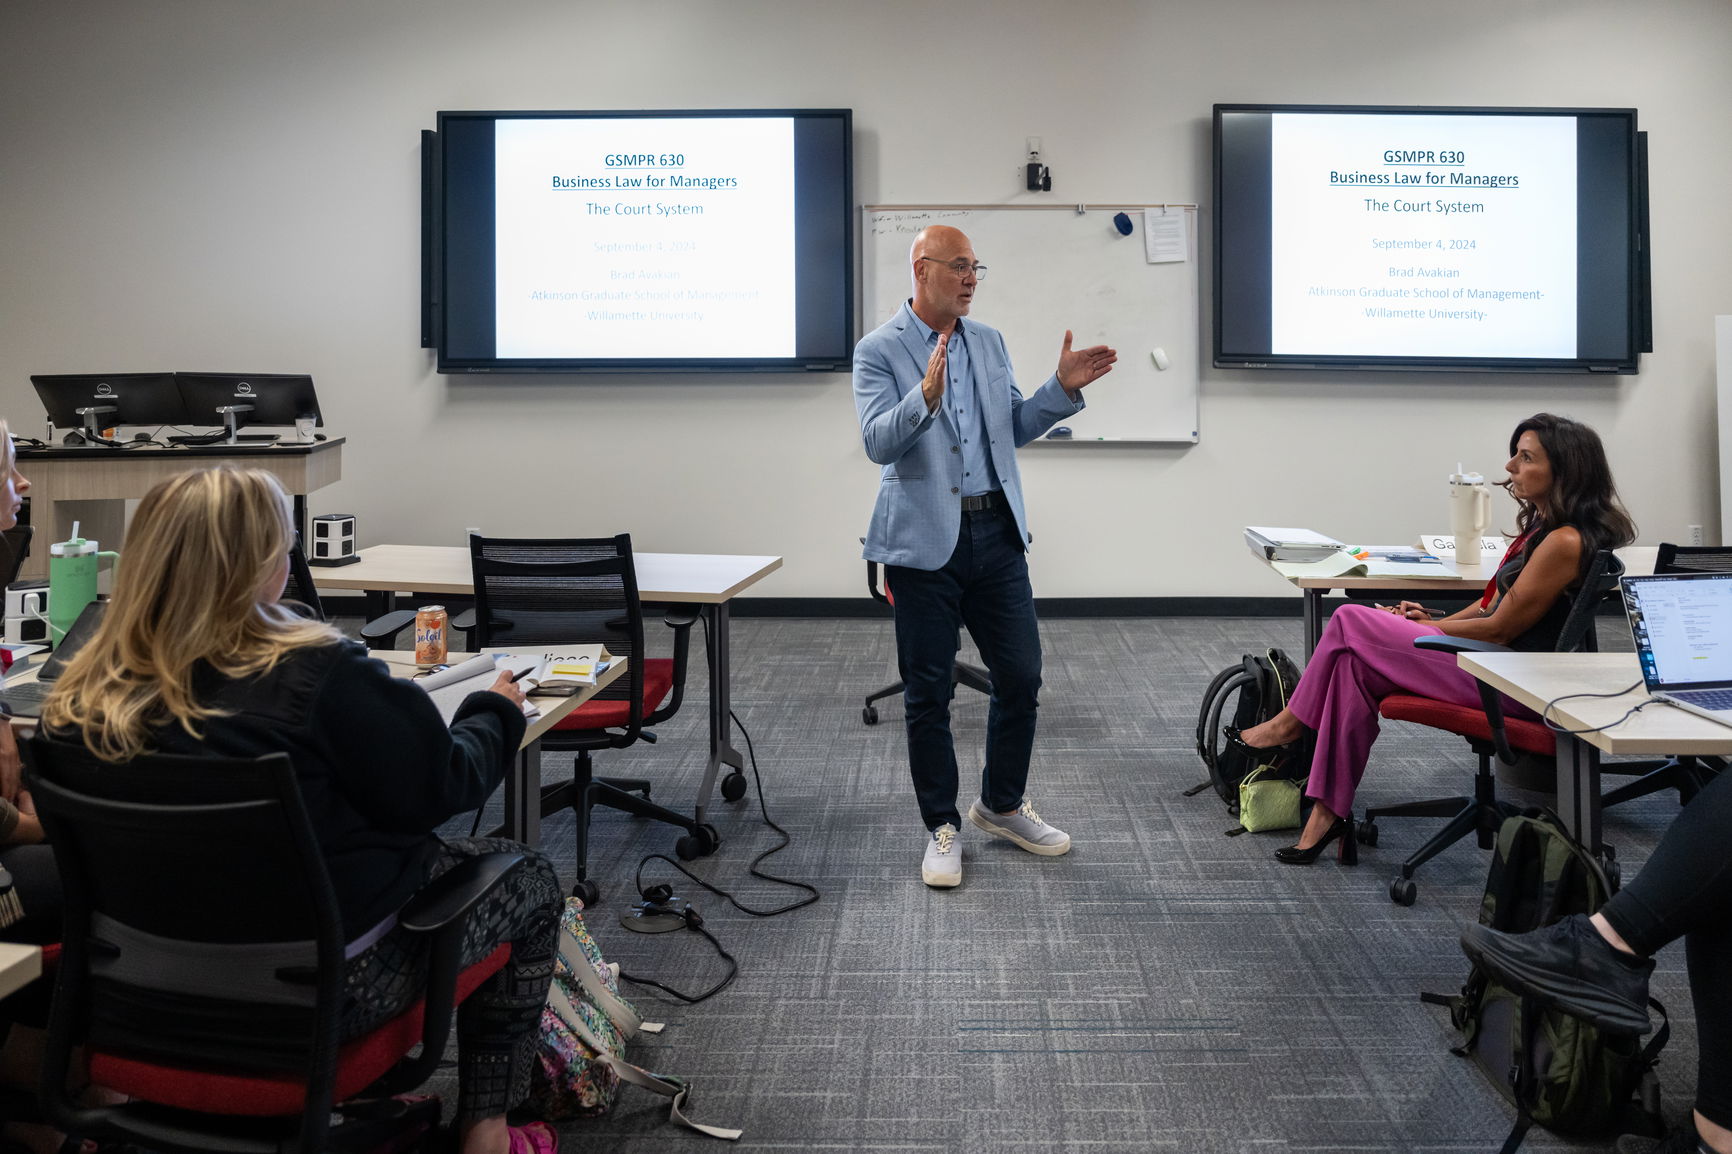
Our distinguished faculty are influential in their fields—and in the classroom. These scholars and practitioners bring intellectual curiosity and real-world insight to our MBA program, and their original research benefits communities near and far.

MBA students gain real-world experience through case studies, internships and student-managed portfolios, including the O’Neill Investment Fund, Angel Fund, and Philanthropic Investment for Community Impact. A hallmark experience of the Early Career & Career Change MBA students is PACE—Practical Application for Careers and Enterprises, which entails a six-month consulting engagement with a non-profit client.

The first step in applying to a Willamette graduate program is to determine which of our programs is right for you. From there, you can explore the admissions criteria, gather the required documents, and start your application.

LEARN MORE
If you’re looking to take your career to the next level, consider Willamette, Oregon’s premier MBA program. Request more information or start your application today.
Willamette University
Ecotrust Building
721 NW 9th Ave
Portland
Oregon
97209
U.S.A.